Sentiment analysis, Elasticsearch and Kibana
The idea
From the Twitter streaming API grab tweets for a live TV show whilst it’s showing, classify by contestant, analyze sentiment and provide a real-time dashboard into the outlook.
Try to predict good bets on the winners. Optional: Gamble. :-)
The tools
- Grabbing the data: Scala and the twitter4j Java library
- Sentiment analysis: SentiStrength
- Search engine: Elasticsearch
- Dashboard: Kibana (also from the Elasticsearch guys)
The show
I picked the final of the BBC’s “Strictly Come Dancing” in the UK. My wife is an avid viewer, myself less, so I’m generally consigned to the laptop whilst it’s on. This was a welcome distraction.

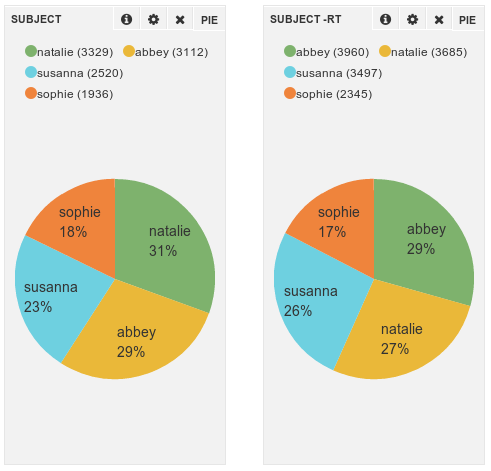
During the show I gathered 63,000 tweets, peaking at 35 per second at the busiest point. Elasticsearch and Kibana didn’t break a sweat.
@who?
Most tweets were very easy to classify by one of the 4 contestants - they tend to mention a name or twitter account and the names were all distinct and unambiguous (Natalie Gumede, Abbey Clancy, Sophie Ellis-Bextor, Susanna Reid). If a tweet was ambiguous, ie. mentioned more than one contestant it’d be tagged with both, but only those tagged with a single contestant were used.

#sentiment
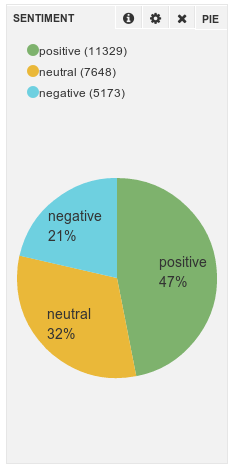
The Sentiment classifier classified tweets into one of: Negative, Neutral or Positive.

Interestingly, the sentiment analysis didn’t provide any huge revelations. Most tweeters were largely positive (there were no big upsets during the dancing, I’m reliably informed), so relative proportions of negative/neutral/positive for each contestant were very similar.
I noticed the SentiStrength library produced a few misclassifications for the negative examples - classifying such short text as tweets is a particularly hard problem to do accurately.
In a show with stronger opinions it may be this could play a more significant part.
Kibana
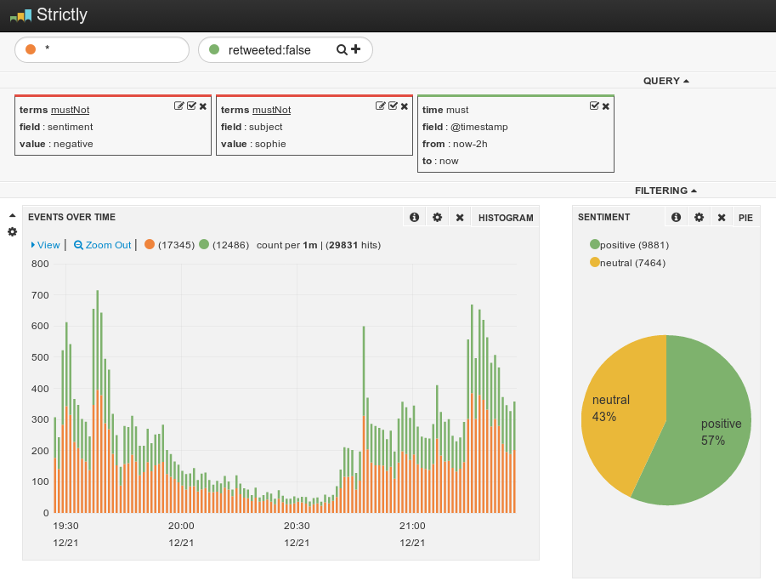
Kibana is a great tool for visualizing time series data in Elasticsearch. It’s aimed at dashboards for log files and this problem was a remarkably good fit, and speaks volumes for the flexibility and power of this nice javascript app.

The above screenshot was after the first elimination of Sophie - it was easy to adjust the query at this point to exclude those tweets. On the timeseries graph you can spot the peaks as each contestants performed for the 1st and 2nd time.
Profit?
I placed some small bets on a betting market whilst the show was running. The best bet was on the 4th place position. This didn’t happen as the market had assumed (Sophie went out, not Natalie) but twitter correctly predicted this one, so the odds I got of 3.9 produced decent winnings.
The 1st place didn’t predict a clear winner - it was close enough that I figured hedging my bets made most sense at that point, so made minimal winnings of a couple of pounds on this bet.
If there’s the demand, I’ll clean up the code and put it on github.