This is part 1 of 2 about using Elasticsearch and Kibana to track patterns in baby activity.
Part 2 is here.
Kicking things off
According to countthekicks.org “Counting baby kicks is important because changes in your baby’s movement pattern may indicate potential problems with your pregnancy”. Counting and patterns sounds like a technological problem for Elasticsearch and Kibana!
There’s a few apps dedicated to tracking kicks (over 20 apps last count on Android), but they’re mostly crap (lacking detailed history or useful insights) and being a data geek I’m not entirely happy handing over the data without a definite means to export it.
Also I figured the process of capturing the kicks could be done better - my wife was finding opening an app every kick and hitting the right button tedious – especially in the middle of the night.
Hardware
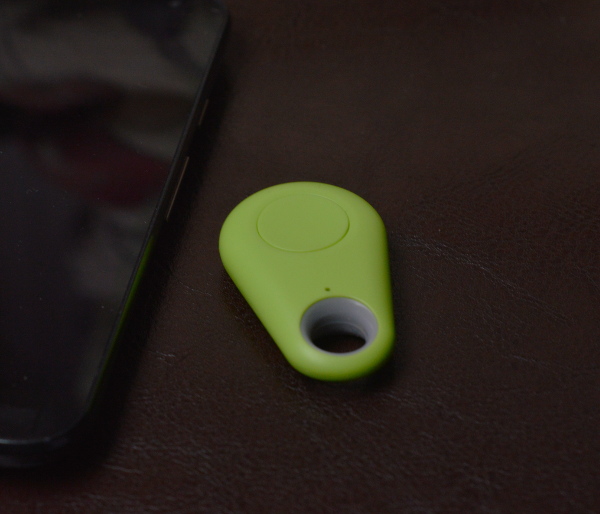
So onto the hardware: a bluetooth button with an associated app on the phone that can perform a custom task when the button is hit. Finding the right button/app combo proved a little trickier - a couple of orders of other buttons showed the standard selfie buttons flooding ebay aren’t good. They’re just pretend bluetooth keyboards, so have to be turned on and off to preserve battery, and catching the emulated button press they emit on the phone is a bit hacky.

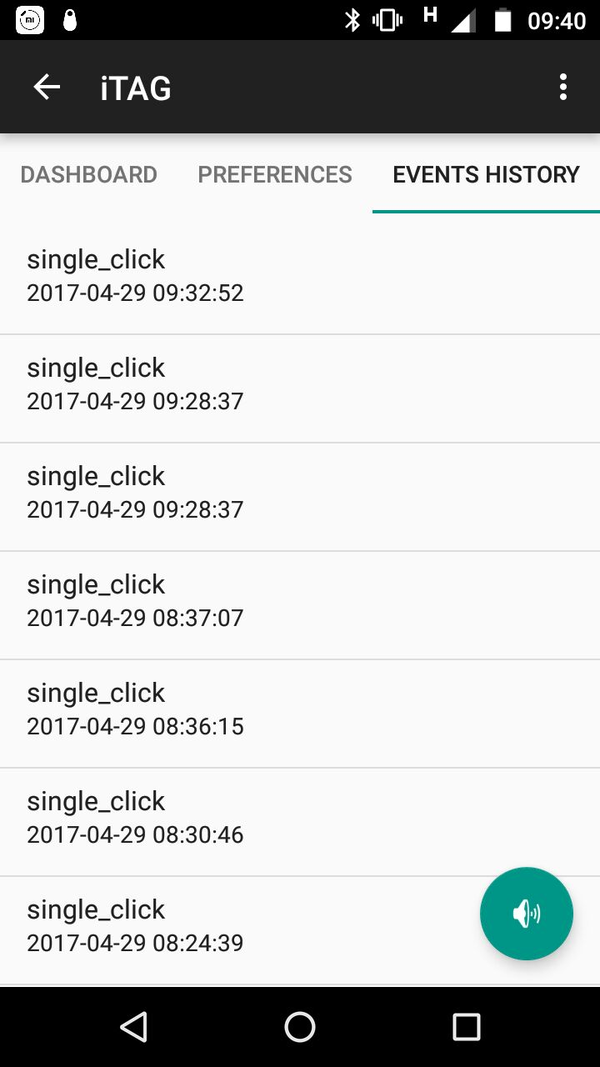
After a couple of mis-orders I found the perfect fit - a bluetooth LE button and the play store itracing2 app. Being Bluetooth LE the button can stay always on, and the app supports calling a custom URL when the button is hit. Just what I needed.

In the app under Preferences, just configure simple click options -> call a url and set the custom action: url.
Server side
To receive the http call I wrote a quick and dirty python flask script. All this script would do is create a timestamped document in elasticsearch, log to a file (just in case), and return 200.
index.py Flask script
from flask import Flask
import datetime
import elasticsearch

app = Flask(__name__)

@app.route('/bump')
def bump():
    now = datetime.datetime.now()
    timestamp = now.strftime('%Y-%m-%dT%H:%M:%S')
    with open('bumps.txt', 'a') as fout:
        print(timestamp, file=fout)
    es = elasticsearch.Elasticsearch()
    es.index(index='bumps', doc_type='bump', body={'timestamp': timestamp, 'action': 'bump'}, refresh=True)
    return 'Bumped'
Droplet
For hosting this I only needed a very basic VM so I went with Digitalocean - it can all squeeze on the $5/month droplet with 512MB memory.
The rest of the setup was pretty straightforward: create a systemd config for the python script to ensure it stays running as a service, install nginx and setup as a proxy with http auth in front of this script, and I also setup cloudflare to put https in front (could have equally used letsencrypt here).
I installed of Elasticsearch and Kibana was from .deb packages, with just a
couple of tweaks to run on this memory-constrained droplet:
Adjust elasticsearch memory parameters in /etc/elasticsearch/jvm.options:
-Xms512m
-Xmx512m
And add swap:
fallocate -l 1G /swap
mkswap /swap
chmod 0600 /swap
echo '/swap none swap sw 0 0' >> /etc/fstab
swapon -a
Kibana
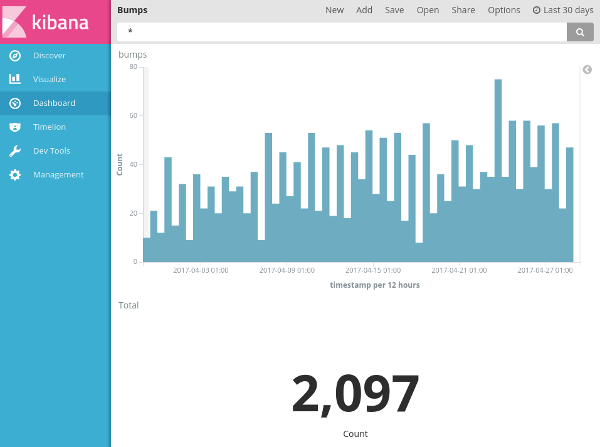
And finally the results visualised in a simple Kibana dashboard:

Kibana allows the full history to be queried which is something apps lacked and has scored well on the wife-acceptance-factor (most importantly!).
You can see straightaway a day/night pattern. I suspect this is because the observer has to sleep at some point!
There’s lots of potential for analysis (eg. Holt-Winters), and turns out as I was writing this post Elasticsearch released their new machine learning to beta! It looks like the perfect fit, supporting anomaly detection for time series and alerting. I’m going to cover this in the second part of this blog post. It will be interesting to see how it copes on this (relatively) small data set.